 |
| Visual Presentation |
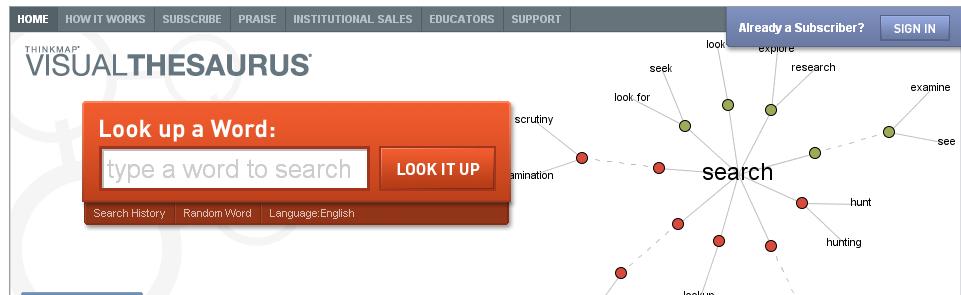 |
| Screen Grab of Visual Thesaurus |
My wife’s Uncle settled in Canada started a family tree project. He did the painstaking work of compiling the name, details, etc of relatives, then created a large database of family members. Apart from collecting the details, he created a newsletter, and a website where he listed the details of family members.
While his effort was commendable, the presentation was not in a visually attractive way. Well, he did the task with minimal investment, so it’s understandable that it was presented in list format.
How to turn day into a visually interesting manner?
There are two things I found that could add more value to the family tree.One is about the details of people. Apart from collecting the name, age, and details of spouses, here’s something to add more value. Add a field to mention the reason of death of people who have expired. This could help in finding the probablity of carrying diseases which are genetically transmitted. For instance if the family has a history of diabetics, or eczima, or heart disorder, then there is a chance of this being inherited.
Next is visual presentation
I owe this idea to VisualThesarus. This thesaurus site has differentiated themselves in the way they have presented the information. The floating graphics and the connection of words presented in a networked way makes it easy and interesting way for people to explore the meaning, synonyms, or understand the connection between words.
Taking cue from this site, I wonder if we could build a family tree structure. If such a application exists, it would make things for people like this uncle in Canada to add data. And, when data is represented in a such a format, it will be easy for people to see the connection in the family, and increase the engagement with the application. Moreover, people will be more likely to click to explore the family network.
I hope my plan is workable!!!
Your’s Visually!
